
Report Builder
Build and edit custom reports visually, with no SQL to write directly — the result runs through the same Reports API as the standard reports.
The Standard Reports catalogue covers the 17 reports available out of the box, but most tenants eventually need something specific to their own program. Report Builder is a visual, drag-and-drop tool for creating and editing exactly that kind of custom report — joining tables, filtering, grouping and aggregating — without writing SQL by hand. Once saved, a Report Builder report is callable through the Reports API using its reportId, exactly like any standard report.
Report Builder is available as a portlet on every tenant, called Report Builder under the Portlets tab in the Admin Portal.
Tables and Fields Panel
The left panel lists every reportable table, grouped by area (Wallet & Wallet Type, Payments & Money Movement, Customers & Identity, Organisations, Cards, Beneficiaries/Terminals/Stores, Fraud & Compliance, Notifications & Events). Each table shows a business-friendly name with its underlying database table name beneath it, and each field shows its data type (STRING, NUMBER, DATE, DATETIME) and a warning icon on sensitive fields (PAN data, tokens, secrets).
Once a table is added to the report, tables it can be joined to stay selectable; tables with no join path from what's already in the report are greyed out.
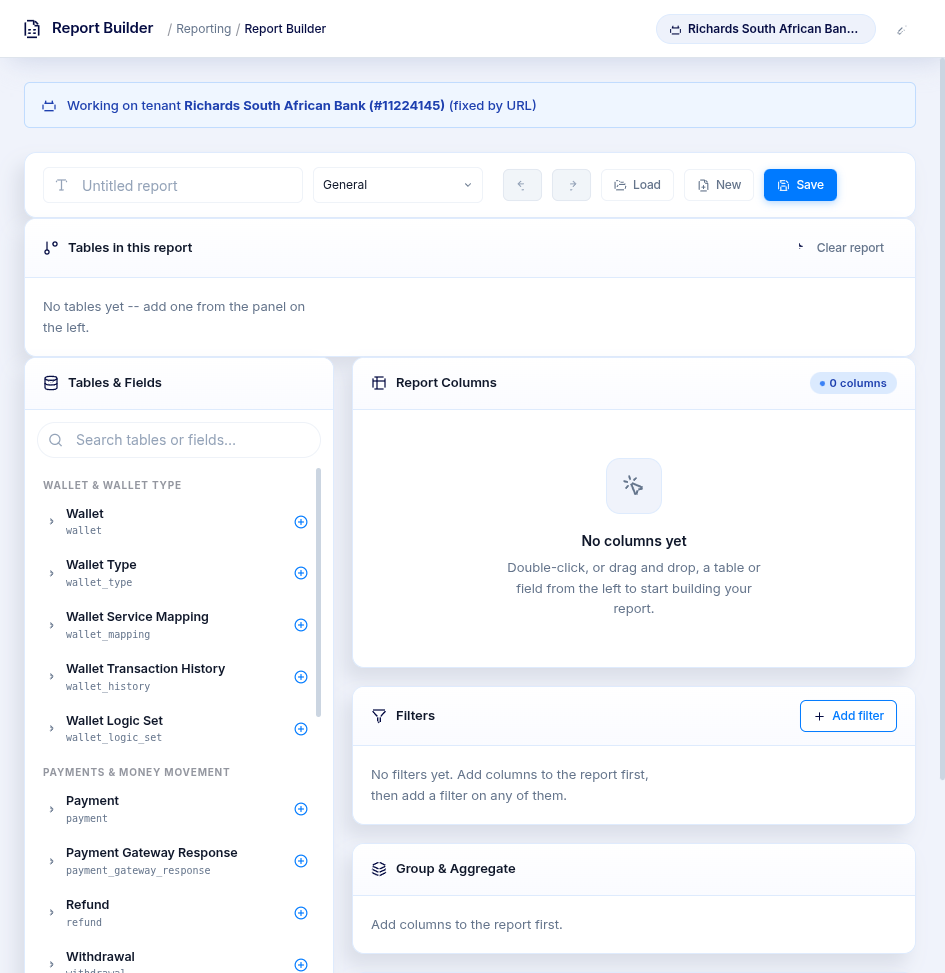
Building a Report
- Add a table or field — double-click it, or drag and drop it onto the report canvas. Adding a table pulls in all of its fields as columns; adding a single field adds just that field (and its table, if not already present).
- Join another table — double-click or drag a table that's connected — by a foreign key, or a known relationship — to a table already in the report. The join is added automatically, and the Tables in this report strip above the canvas shows the join path (for example, "Wallet → Customer via user_id = e0.user_id").
- Remove a table — click the × on its chip in the Tables in this report strip, or on its entry in the left panel. A table can only be removed once no other joined table depends on it — the report's root table can't be removed this way; use Clear report to start over instead.
- Rename, delete, or reorder columns — directly in the Report Columns grid: click a column's name to rename it, click × to remove it, or drag its header to reorder it.
- Preview data — two rows of clearly-marked, randomly generated sample values are shown for the columns currently on the canvas, so you can see the report's shape before running it. These are never real records.
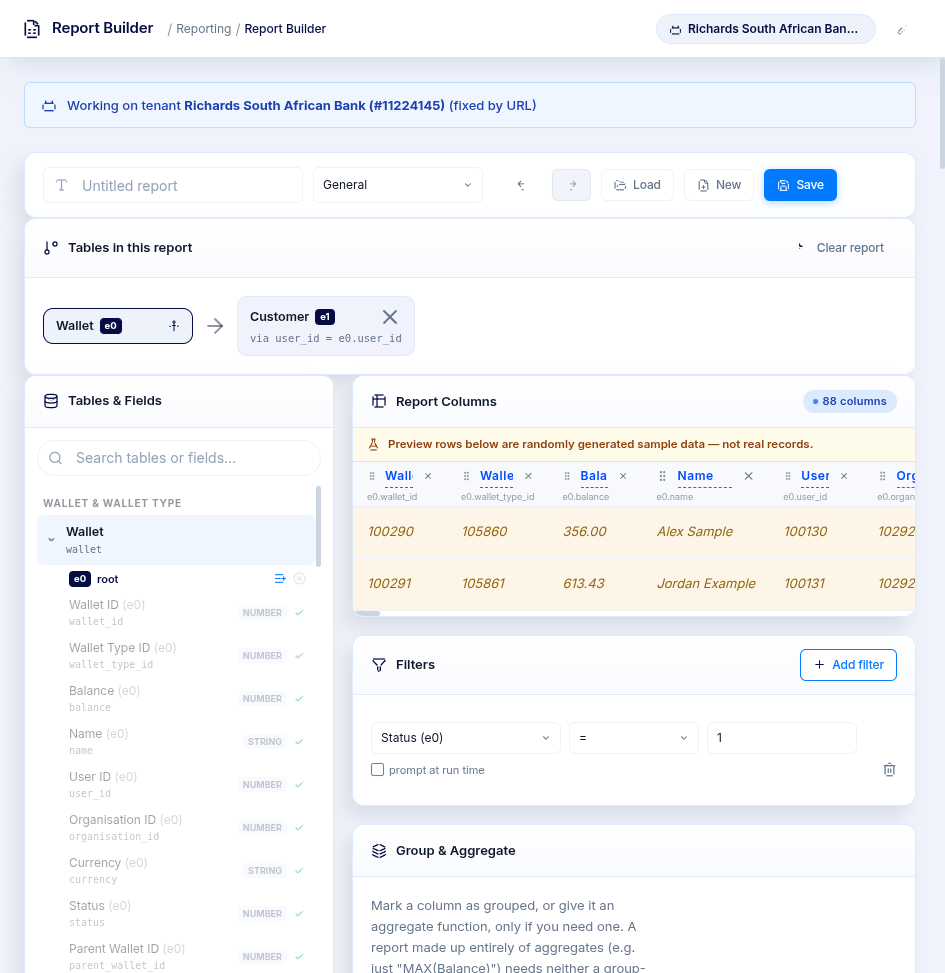
Filters
Click Add filter to filter on any column currently in the report. The available comparisons depend on the column's type:
| Type | Comparisons |
|---|---|
| String | Equals, Not equals, Contains, Starts with, Is empty, Is not empty |
| Number | =, ≠, >, ≥, <, ≤, Between, Is empty, Is not empty |
| Date / DateTime | On, After, On or after, Before, On or before, Between, Is empty, Is not empty |
Each filter's value is either:
- Fixed — baked into the saved report (for example, always filter to
Status = ACTIVE). - Prompt at run time — the person or system running the report supplies the value each time, the same way the standard reports take positionally typed
d#/s#/n#parameters via the Reports API. Give it a clear label (for example, "From Date") — this becomes the parameter's display name.
A report can have up to 8 run-time parameters in total, matching the limit of the Reports API's parameter slots. "Between" filters must use fixed values on both ends.
Grouping and Aggregation
The Group & Aggregate card summarises the report:
- Mark a column grouped to make it a
GROUP BYkey. - Give a column an aggregate function (
SUM,COUNT,AVG,MIN,MAX) to summarise it across each group. - A column can be grouped or aggregated, not both.
You only need to group or aggregate a column once the report mixes it with other grouped or aggregated columns. A report made up entirely of aggregates — for example, just the single value MAX(Balance) across the whole table — needs no grouping at all.
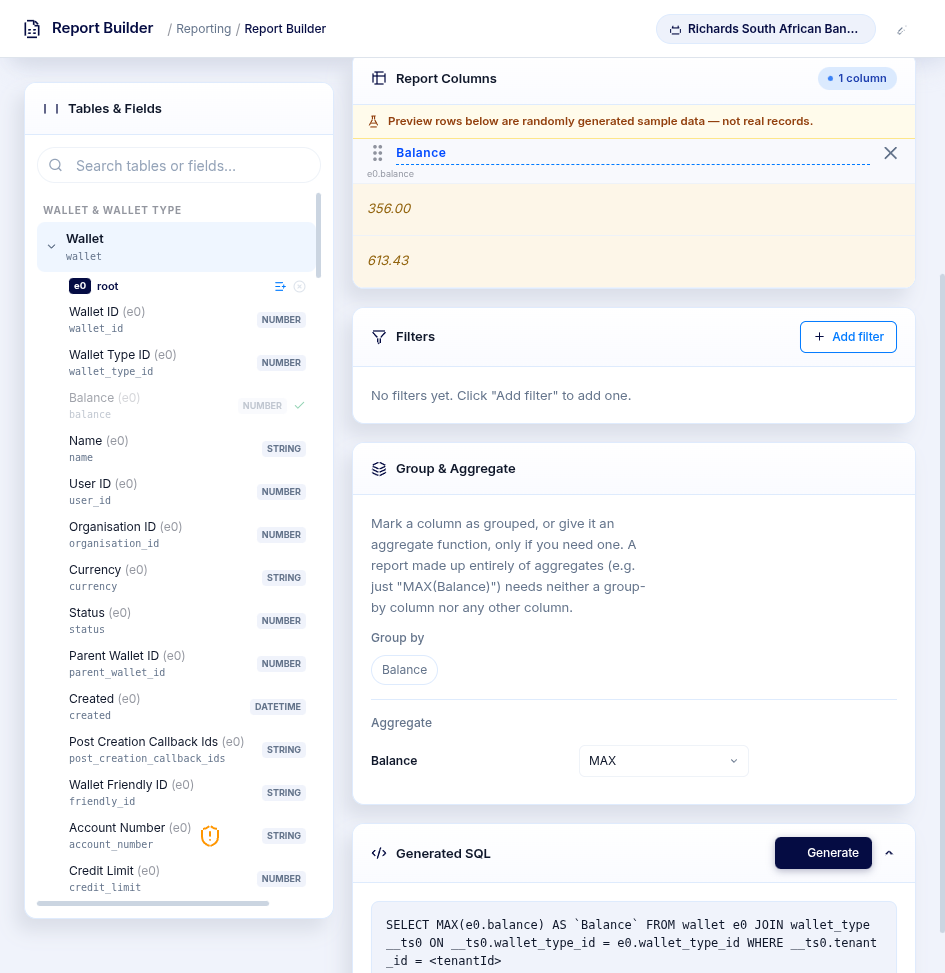
Generating and Reviewing the SQL
Click Generate on the Generated SQL panel at any point to see the exact query the report will run — it only updates on click, so you can keep rearranging the report without it recalculating on every change. Every generated report is automatically scoped to the current tenant (a tenant filter is always added in the background, even when the underlying table has no direct tenant column of its own), and this can't be removed from the builder — the same tenant isolation the Reports API itself guarantees.
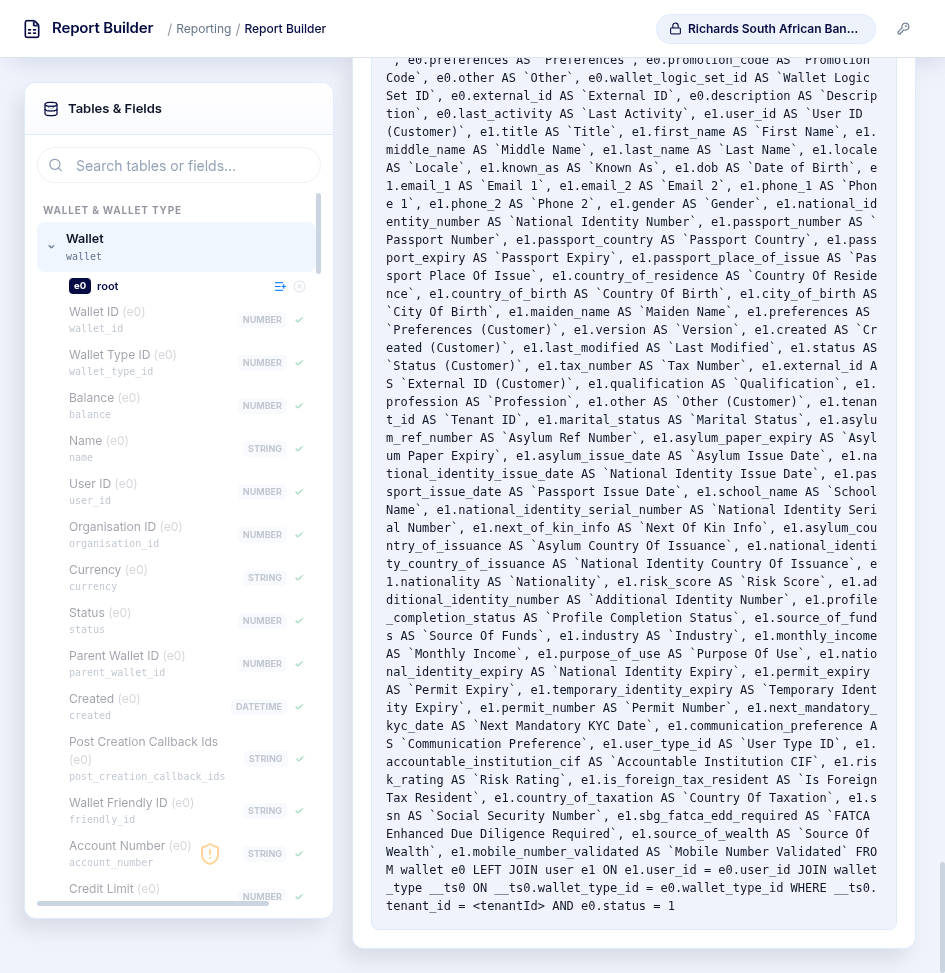
Saving a Report
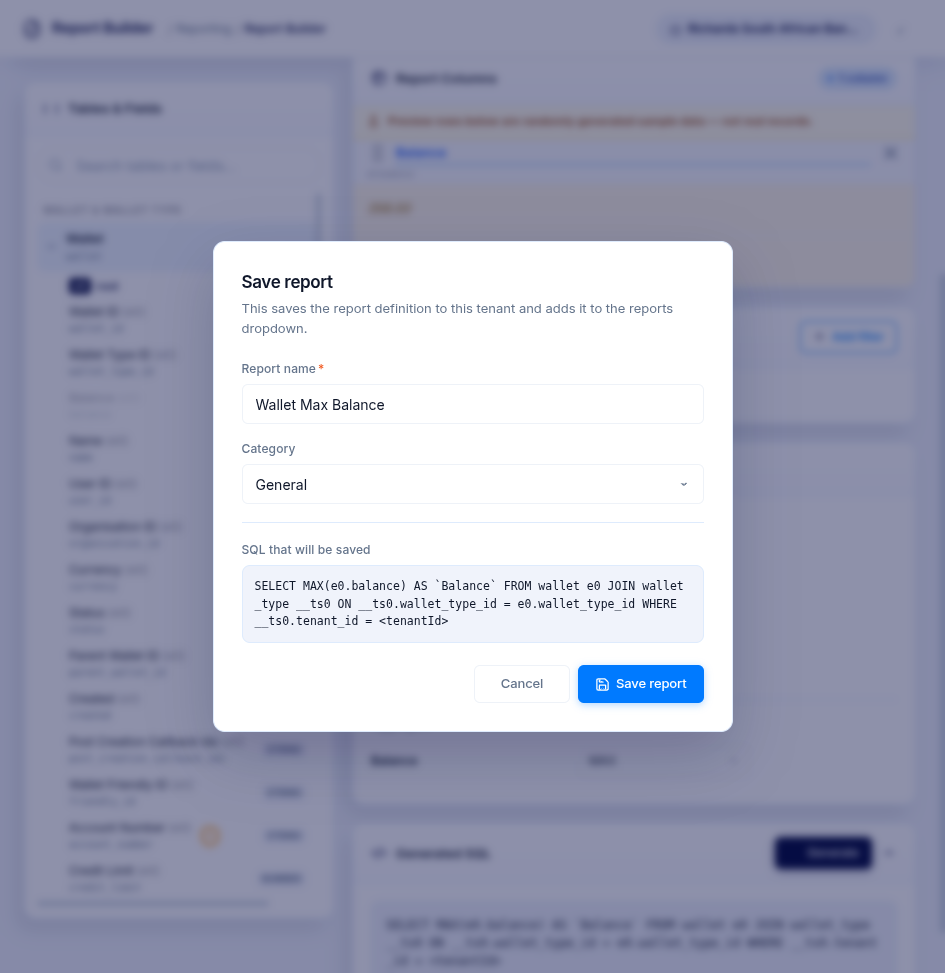
Click Save. You'll be asked for:
- Report name — shown in the Admin Portal's Reports dropdown.
- Category — pick an existing category from this tenant's reports, or type a new one. Leave it as General for the default, uncategorised bucket.
The Save dialog shows the exact SQL that will be saved, along with any run-time parameters and validation warnings. Saving writes the report to this tenant's report catalog and its SQL definition — the report is immediately callable via the Reports API using the reportId you gave it, and appears in the Admin Portal's Reports screen for anyone with access to it.
Loading and Editing a Report
Click Load to see every report already defined for this tenant. Reports built in Report Builder can be reopened and further edited — join more tables, add filters, change grouping, and so on. Reports that weren't created in Report Builder (hand-written, or built before this tool existed) are listed but marked Not editable here, since their SQL can't be reliably translated back into tables, joins, and filters.
Undo and Redo
Every change — adding or removing a table, adding, renaming, or reordering a column, changing a filter, toggling a group or aggregate — can be undone (Ctrl+Z) and redone (Ctrl+Shift+Z), up to the last 50 actions.
Updated about 13 hours ago