
Eclipse Logging
Setting Logging Levels
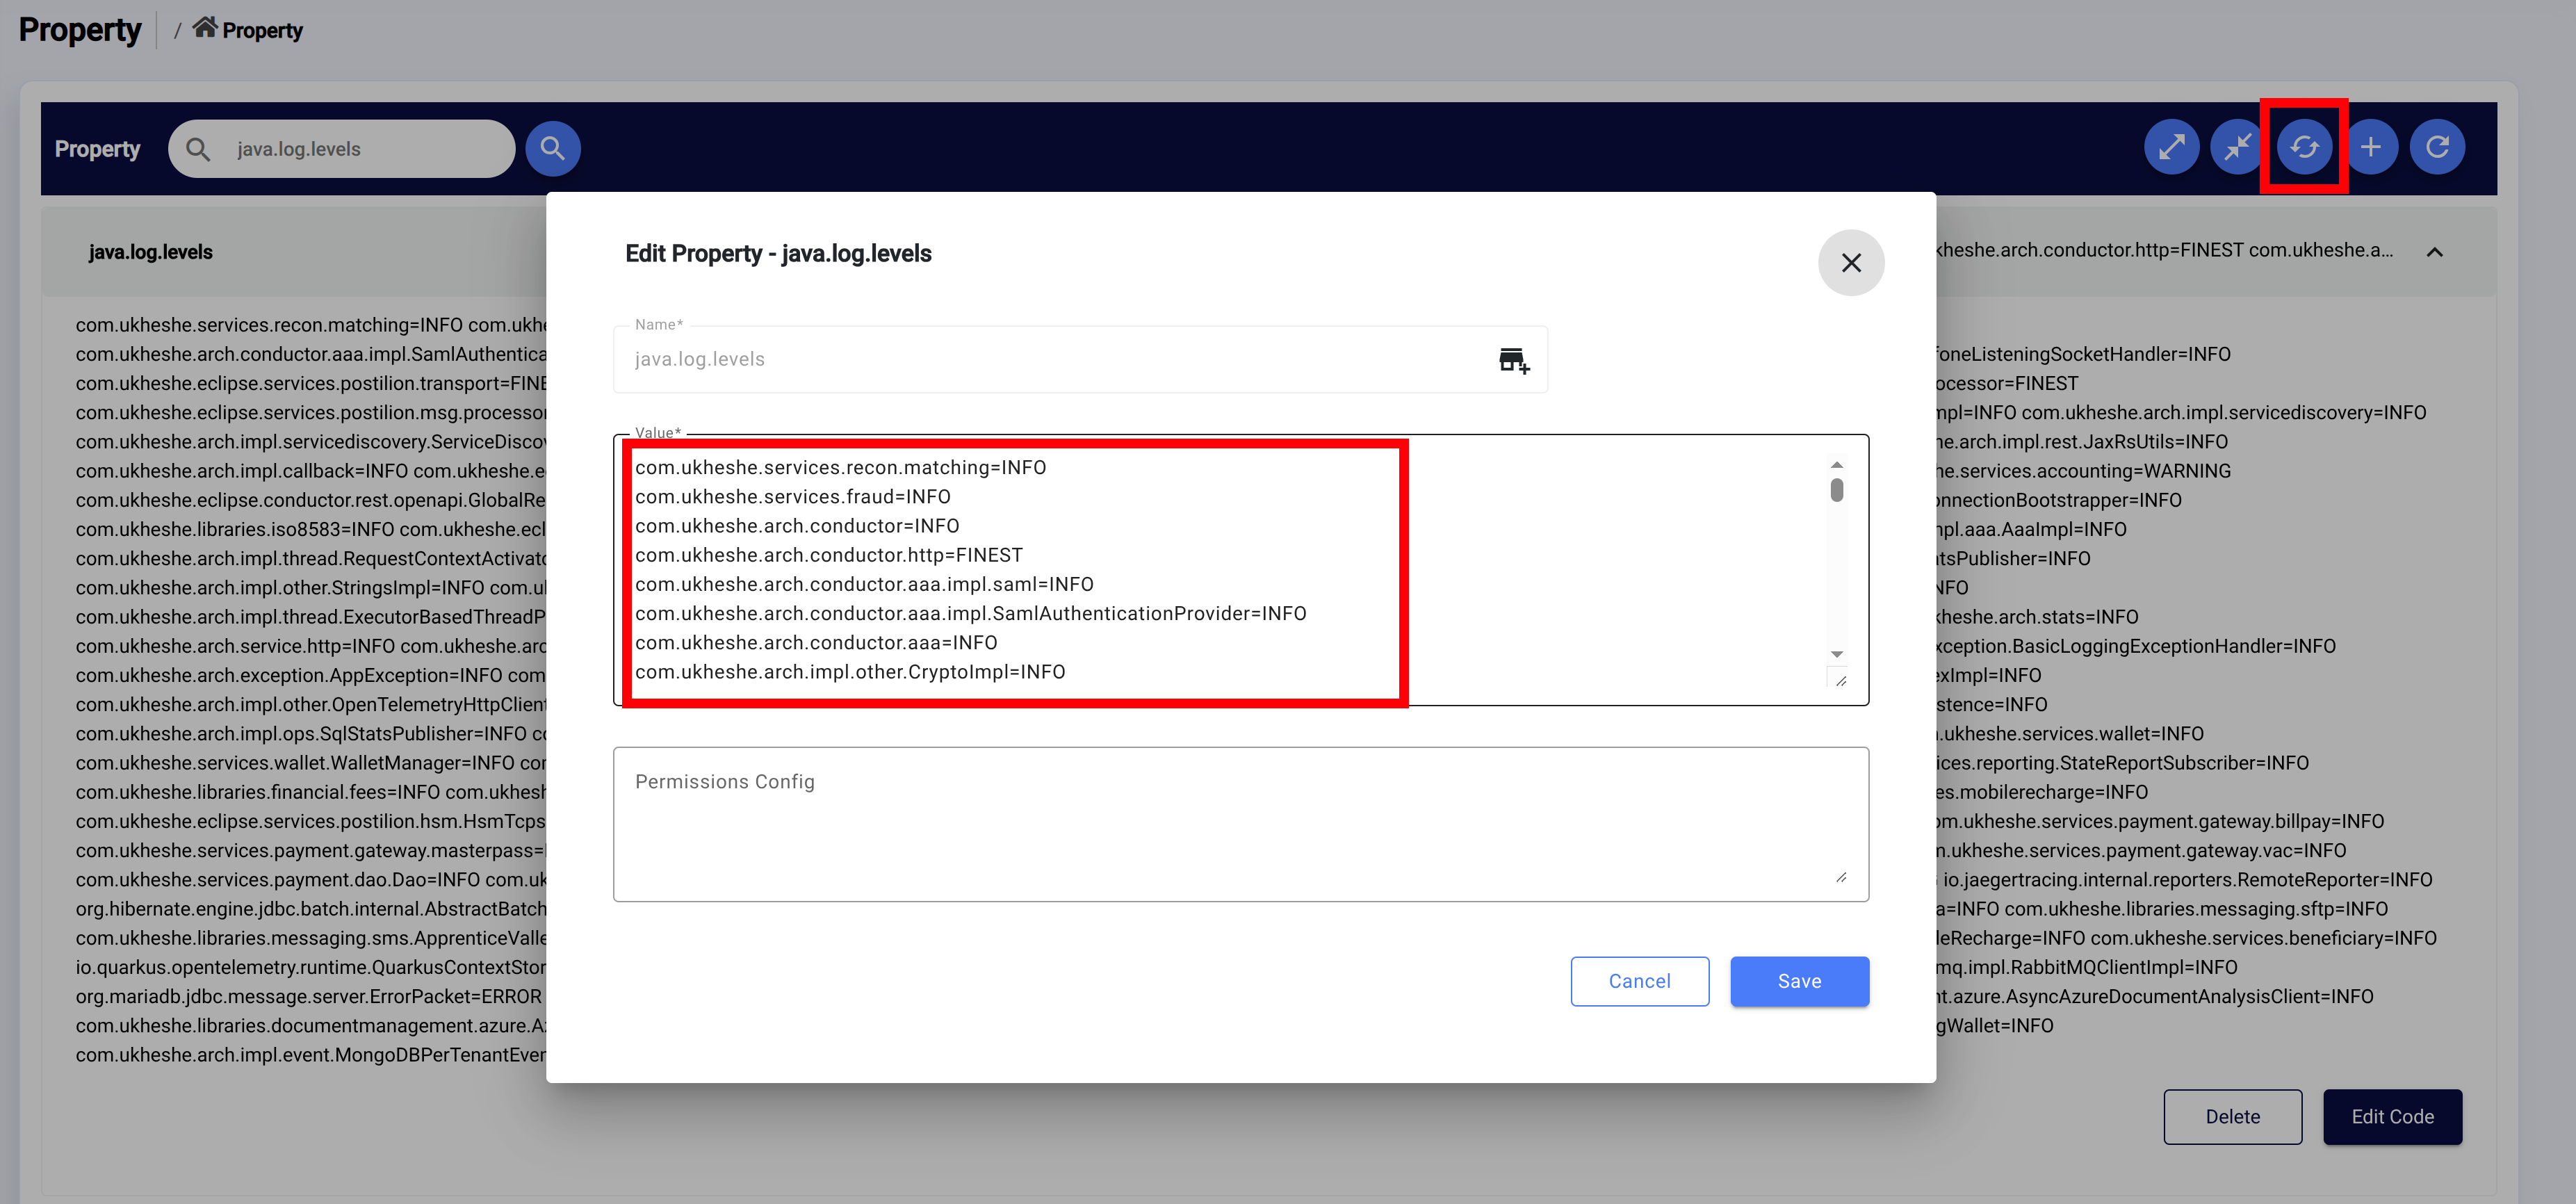
Logging output is controlled via the global property java.log.levels. This can be changed at runtime via the admin portal under Configuration → Global Properties. After changing the property value, click Refresh Cache to apply the new log levels without restarting the container.
Format: <package>.<class>=<LEVEL> — one entry per line, comma-separated or newline-separated.
Valid levels (from least to most verbose): OFF, ERROR, WARNING, INFO, FINEST
Example java.log.levels property value:
com.ukheshe.arch.conductor.http=FINEST
com.ukheshe.eclipse.conductor=INFO
com.ukheshe.services.wallet=INFO
Recommended logging levels:
| Logger | Recommended Level | What it captures |
|---|---|---|
com.ukheshe.arch.conductor.http | FINEST | All inbound and outbound HTTP API calls with request/response body snippets — essential for audit trail and debugging |
com.ukheshe.eclipse.conductor | INFO | Core platform operations, config loading, tenant lifecycle events |
com.ukheshe.services.wallet | INFO | Wallet operations (debits, credits, transfers, reservations) |
com.ukheshe.services.card | INFO | Card issuing, PIN management, card status changes |
When investigating a specific issue at EFTCorp's request, log levels may be temporarily elevated to
FINESTon specific packages. Return them toINFOafter the investigation to avoid excessive log volume and performance impact.
Logging Format
Eclipse produces logs in a JSON format. The fields are as follows (additional fields may be present but these are the key fields):
{
   "hostName" : "{hostname of the server that produced the log e.g. myservera.com}",
   "level" : "{logging level e.g. DEBUG/INFO/WARN/ERROR}",
   "loggerName" : "{name of the logger e.g. com.ukheshe.arch.conductor.http}",
   "message" : "{Logging message}",
   "parentId" : "{Open telemetry tracing parent span id}",
   "sampled" : "{not useful}",
   "sequence" : 1742290,
   "spanId" : "{Open telemetry tracing span id}",
   "threadName" : "{Thread name e.g. v-quarkus-223771}",
   "timestamp" : "{date/time of the log message e.g. 2025-11-12T09:00:24.106Z}",
   "traceId" : "{Open telemetry tracing id}",
   "user.identity" : "{Identity of the user initiating the request that resulted in the log. e.g. apiuser}",
   "user.remoteaddr" : "{IP address of the user initiating the request that resulted in the log e.g. 34.226.134.242}",
   "user.tenantid" : "{Tenant id of the user (if its a tenant user e.g. 10}",
   "user.userid" : "{User id of the user initiating the request that resulted in the log. e.g. 123}",
   "stackTrace": "{Present if the log is of an exception}"

}
Logs are shipped to AWS CloudWatch for SaaS-hosted deployments. On self-hosted environments, logs are available via the container's stdout/stderr and can be ingested into any log analysis tool that supports JSON (e.g. ELK stack, Splunk, Grafana Loki).
Querying Logs
When ingested as JSON, logs can be filtered and searched on any field. Common query patterns:
| Goal | Query |
|---|---|
| Trace a single request end-to-end | Filter on traceId = "<traceId>" |
| Find all errors in a time window | Filter on level = "ERROR" |
| Find all requests by a specific user | Filter on user.identity = "<identity>" |
| Find requests from a specific IP | Filter on user.remoteaddr = "<ip>" |
| Find all activity for a tenant | Filter on user.tenantid = "<tenantId>" |
The traceId field is the most important correlation key — it is the OpenTelemetry trace ID that is propagated through every microservice call, database operation, and external API call triggered by a single inbound request. Always start with traceId when investigating an issue.
Distributed Tracing (Jaeger)
In addition to logs, Eclipse publishes OpenTelemetry traces to Jaeger. Jaeger traces provide a visual timeline of every service call in a request chain with individual span durations and error details. Traces are accessible at:
https://jaeger.ukheshe.rocks/jaeger/trace/<traceId>Use the traceId from a log entry to find the corresponding Jaeger trace. Jaeger is particularly useful for diagnosing latency issues or failures that span multiple microservices.